
Student Achievement Data
VGCC’s Mission Statement
Vance-Granville Community College educates, inspires, and supports a diverse community of learners to achieve professional and personal success.
Public Disclosure of Student Achievement
The Southern Association of Colleges and Schools Commission on Colleges (SACSCOC) Principles of Accreditation Standard 8.1 (Student Achievement) requires institutions to identify, evaluate, and publish goals and outcomes for student achievement appropriate to the institutions’ s mission, the nature of the students it serves, and the kinds of programs offered. It also indicates that the institution should use multiple measures to document student success. Requirements for publications are further specified in the SACSOC Policy on Institutional Obligations for Public Disclosures.
State Data
Vance-Granville Community College utilizes the student achievement measures provided by the North Carolina Community College System. This annual performance report is based on data compiled from the previous year and serves to inform colleges and the public on the performance of all NC community colleges.
The NC Community College System’s performance measures include:
- Basic Skills Student Progress
- Student Success Rate in College-Level English Courses
- First-Year Progression
- Licensure and Certification Passing Rate
- Student Success Rate in College-Level Math Courses
- Curriculum Student Completion
- College Transfer Performance
- NCCCS Performance Measures Dashboard
- 2026 Reporting Year (PDF)
- 2025 Reporting Year (PDF)
- 2024 Reporting Year (PDF)
- 2023 Reporting Year (PDF)
- 2022 Reporting Year (PDF)
- 2021 Reporting Year (PDF)
- 2020 Reporting Year (PDF)
- 2019 Reporting Year (PDF)
- 2018 Reporting Year (PDF)
- 2017 Reporting Year (PDF)
- 2016 Reporting Year (PDF)
- 2015 Reporting Year (PDF)
- 2014 Reporting Year (PDF)
- 2013 Reporting Year (PDF)
- 2026 NCCCS Performance Measures (PDF)
- 2025 NCCCS Performance Measures (PDF)
- 2024 NCCCS Performance Measures (PDF)
- 2023 NCCCS Performance Measures (PDF)
- 2022 NCCCS Performance Measures (PDF)
- 2021 NCCCS Performance Measures (PDF)
- 2020 NCCCS Performance Measures (PDF)
- 2019 NCCCS Performance Measures (PDF)
- 2018 NCCCS Performance Measures (PDF)
- 2017 NCCCS Performance Measures (PDF)
- 2016 NCCCS Performance Measures (PDF)
- 2015 NCCCS Performance Measures (PDF)
SACSCOC Student Completion Metric
In accordance with the Southern Association of Colleges and Schools Commission on Colleges (SACSCOC) Principles of Accreditation Core Requirement 8.1 (Student Achievement) Vance-Granville Community College chose the IPEDS 150% Graduation Rate as its graduation rate indicator.
IPEDS Data Feedback Reports for VGCC (2025, 2024, 2023, 2022, 2021, 2020, 2019, 2018, 2017, 2016, 2015)
Student Completion Indicator (IPEDS 150% Graduation Rates)
Integrated Postsecondary Education Data System (IPEDS) graduation rates (GR) provides our College with a significant indicator of student achievement and outcomes by way of student completions. IPEDS graduation rates provide institutional productivity by making use of institutional and comparison group data including graduation rates separated by demographic factors amongst peer groups. The comparison group’s data provides our college context when analyzing our college’s indicators. IPEDS draws from our college’s characteristics; such as, Associate’s Colleges: Mixed Transfer/Career and Technical-Mixed Traditional/Nontraditional, public, and enrollment of a similar size, when selecting a comparison group made up of 32-34 colleges. The data collected are full-time, first-time degree and certificate-seeking undergraduate students.
The following table compares VGCC 150% Graduation Rate against its IPEDS comparison group.
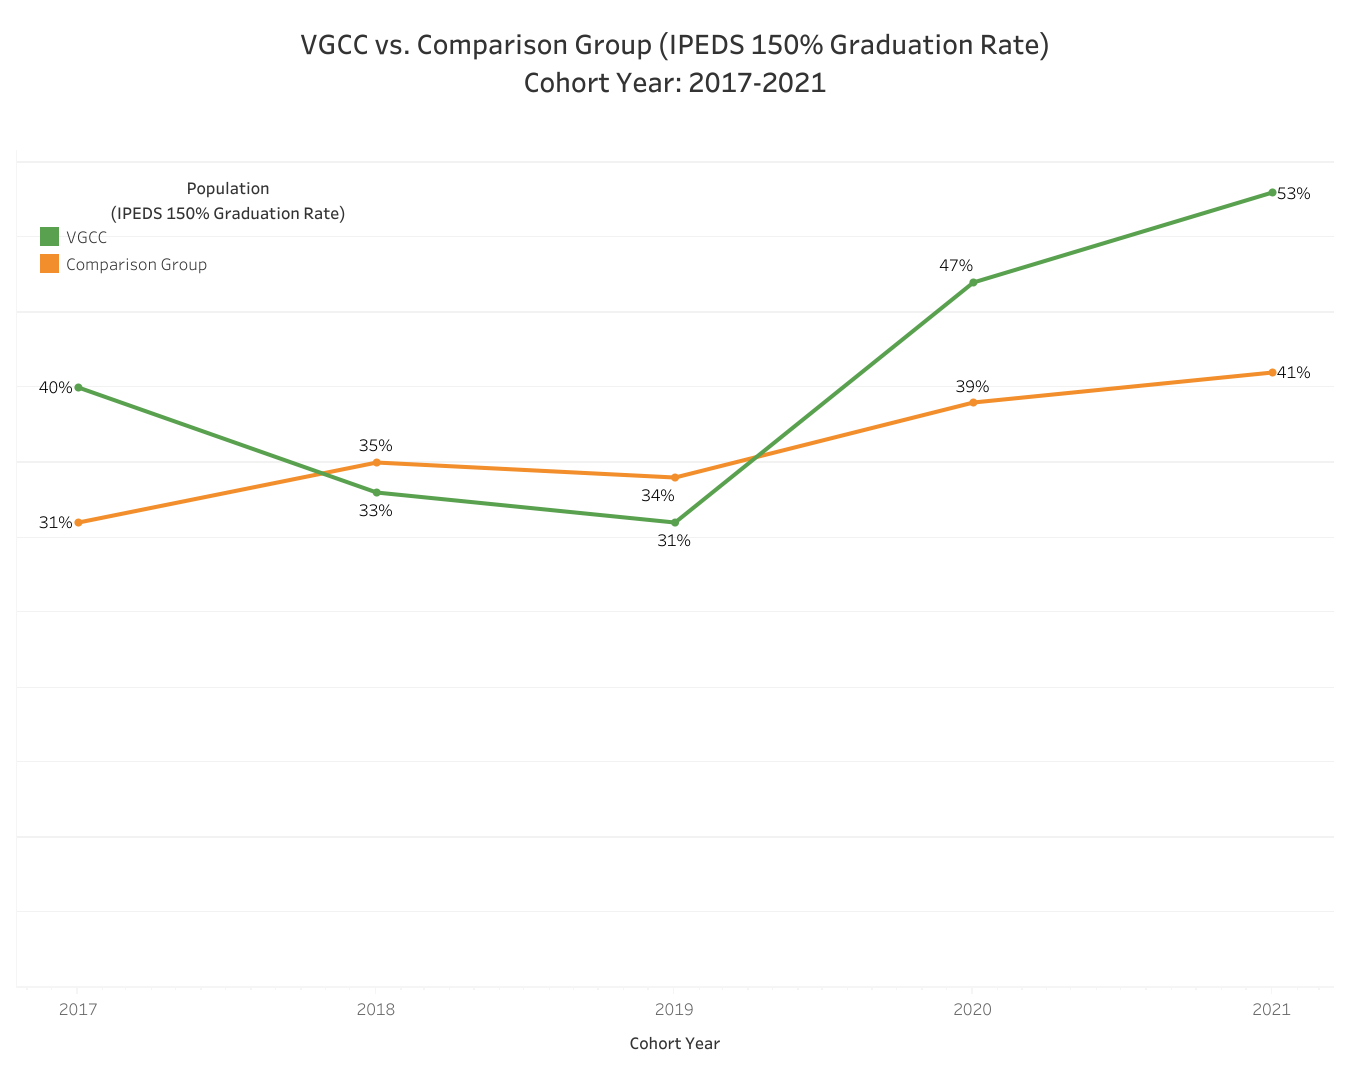
IPEDS 150% Graduation Rate
| Fall Term Cohort | VGCC | Comparison Group |
|---|---|---|
| 2017 | 40% | 31% |
| 2018 | 33% | 35% |
| 2019 | 31% | 34% |
| 2020 | 47% | 39% |
| 2021 | 53% | 41% |
VGCC’s Excellence: 50%
VGCC’s College Average: 41%
VGCC’s Baseline: 22%
Excellence and Baseline levels will be re-evaluated every three years.
(To remain consistent with our state performance measure’s methodology, the baseline level is set at two standard deviations below the mean and the excellence levels are set at one standard deviation above the mean.)